
Web Service to Retrieve Consumer Prices
From open data to a queryable backend: cleaning a historical consumer price dataset from Uruguay (2016-2025), modeling it in PostgreSQL, and sharing practical lessons from the process.
This post is dedicated to a research and development project based on the open historical consumer price dataset in Uruguay, covering almost 10 years (2016 to 2025).
It is aimed at people curious about data, as well as tech folks (data science, backend, etc.) who enjoy reading how something was built, including real bumps and imperfect decisions.
TL;DR: I built a historical consumer price dataset for basic basket products in Uruguay with daily data from 2016-01-01 to 2025-12-31 (10 years of records). The original dataset had around 200 million records. After several cleaning iterations, I ended with a stable version of 774,716 records, removing anomalous values along the way. With that base, I loaded the data into a relational database (normalizing categories and products) and built a backend to query and analyze it.
Context
I started this project for a simple reason: I wanted to test my backend skills with a large dataset. I wanted real friction: inconsistent data, volume, modeling decisions, and import times.
While searching for datasets with practical value, I ended up in the Open Data Catalog. The one that made the most sense in terms of utility and complexity was the historical data from the Consumer Price Information System maintained by Uruguay’s MEF.
In my case, the starting point was several large files (per year: ~20 million rows, around 1.5 GB).
Some of the early issues I found:
- Some values were badly formatted and read as strings (especially prices).
- There were format differences across files (delimiters
;vs,, encodings, etc.). - The dataset included metadata and documentation, but validation was still necessary.
Selecting relevant data
I wanted a historical product price dataset, not a full establishment system.
- I left out the
establecimientosdataset because it was not necessary for my goal. - I reduced the
preciosdataset and shaped it into a backend- and analysis-friendly table.
During this process, I also found inconsistencies between catalogs and prices (IDs, separators, etc.). And although the product catalog remained fairly stable year over year, new products appeared in 2025. There were also products in the catalog that never had real price history.
From raw dataset to a workable format
The turning point for me was accepting that if I wanted to build something queryable and maintainable, I needed a format that could handle real usage. Raw data without clear structure was not enough. I needed something that could:
- plot data without breaking because of one store,
- query quickly by date range,
- import into a relational database without pain.
So I transformed the data into an aggregated version by product and day, where each day summarizes price behavior (minimums, maximums, and typical values). That consolidated version (called V1 in the docs) ended with 817,842 records.
Cleaning and outliers
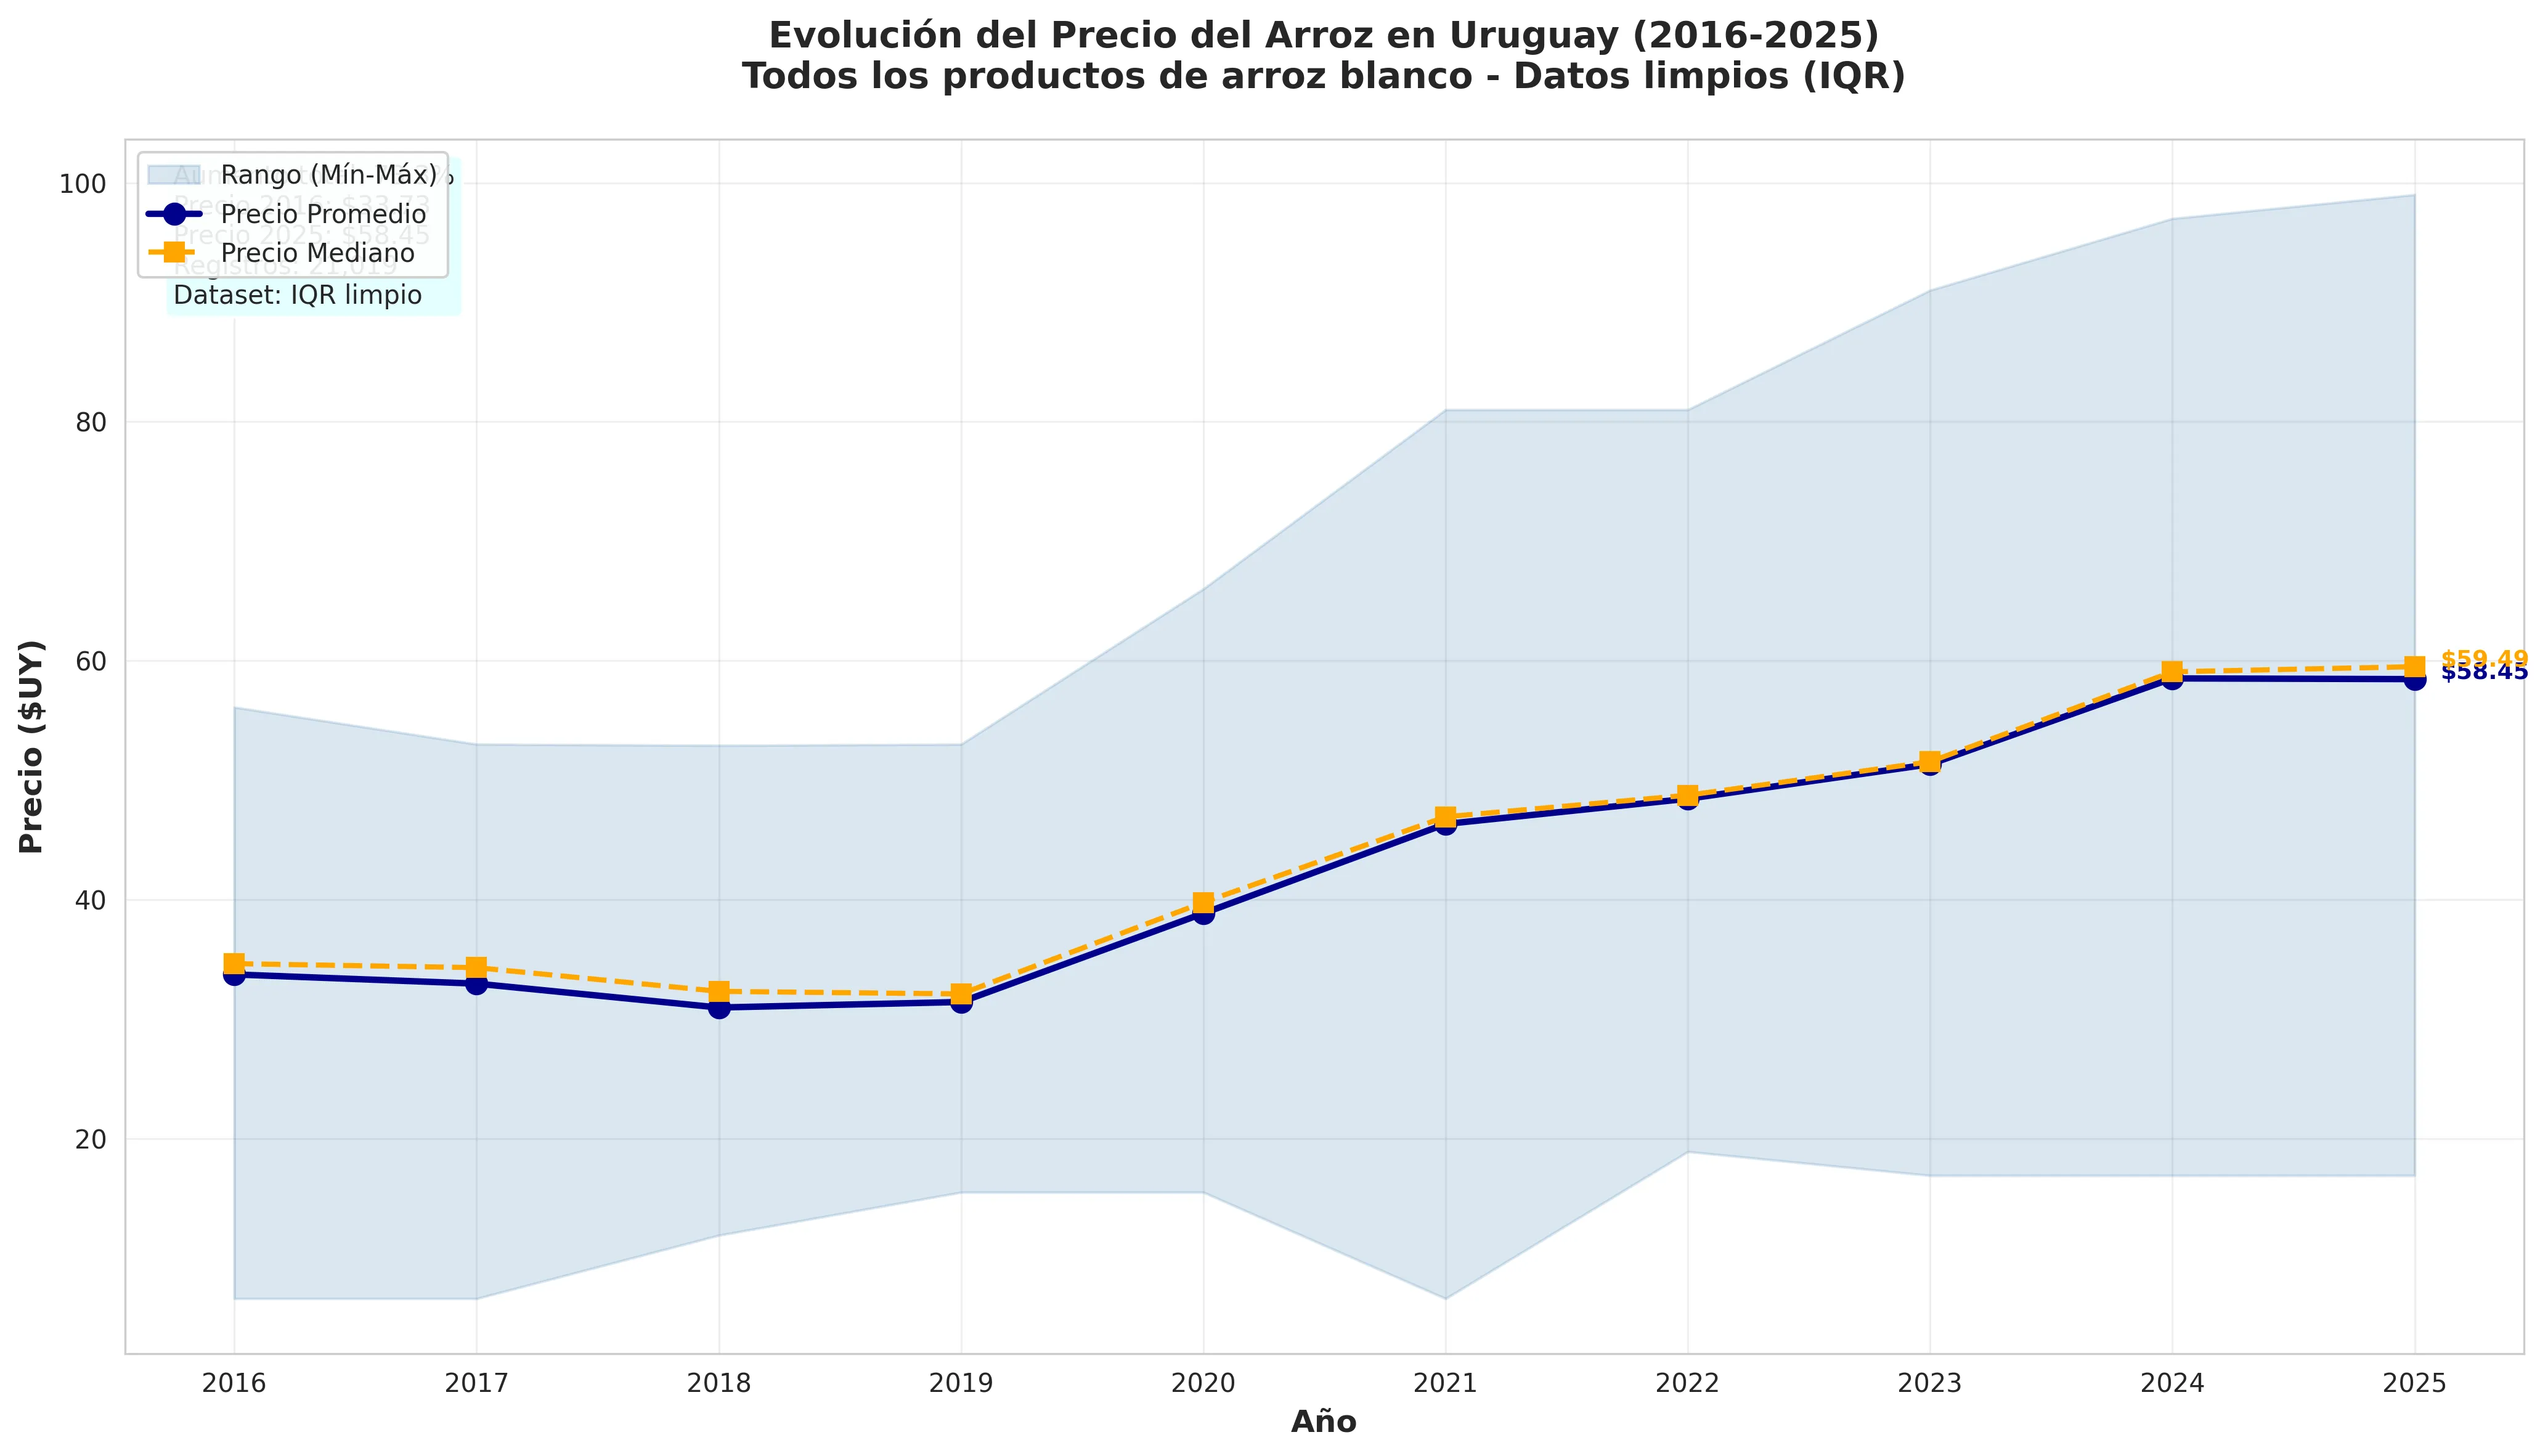
At one point I tried something simple: visualize how rice prices evolved over the years.
The chart immediately exposed a problem: minimum and maximum values in certain periods were completely out of scale. It was not a real variation; it was clearly data that did not belong to the same distribution.
The challenge of cleaning prices across a decade
When working with prices across long periods, there is an obvious but easy-to-underestimate detail: inflation exists. You cannot put a normal 2016 price and a normal 2025 price into the same bucket and expect a fixed threshold to work.
So instead of looking at everything at once, I started comparing products with peers inside bounded time windows. That let me detect what was unusual without penalizing natural price growth over time.
Iterations (V1 -> V4)
This project had several dataset versions, but the short story is:
- V1: consolidated without cleaning (useful to understand the problem).
- V2/V3: an initial conservative approach, useful for removing what was obviously broken, but limited in subtler cases.
- V4: a more robust approach, where criteria adapt better to data reality.
The case that fully convinced me was the one that broke the chart:
- There are records where the average looks reasonable,
- but a store’s maximum jumps to an absurd number,
- and if you only look at the average, the issue stays hidden.
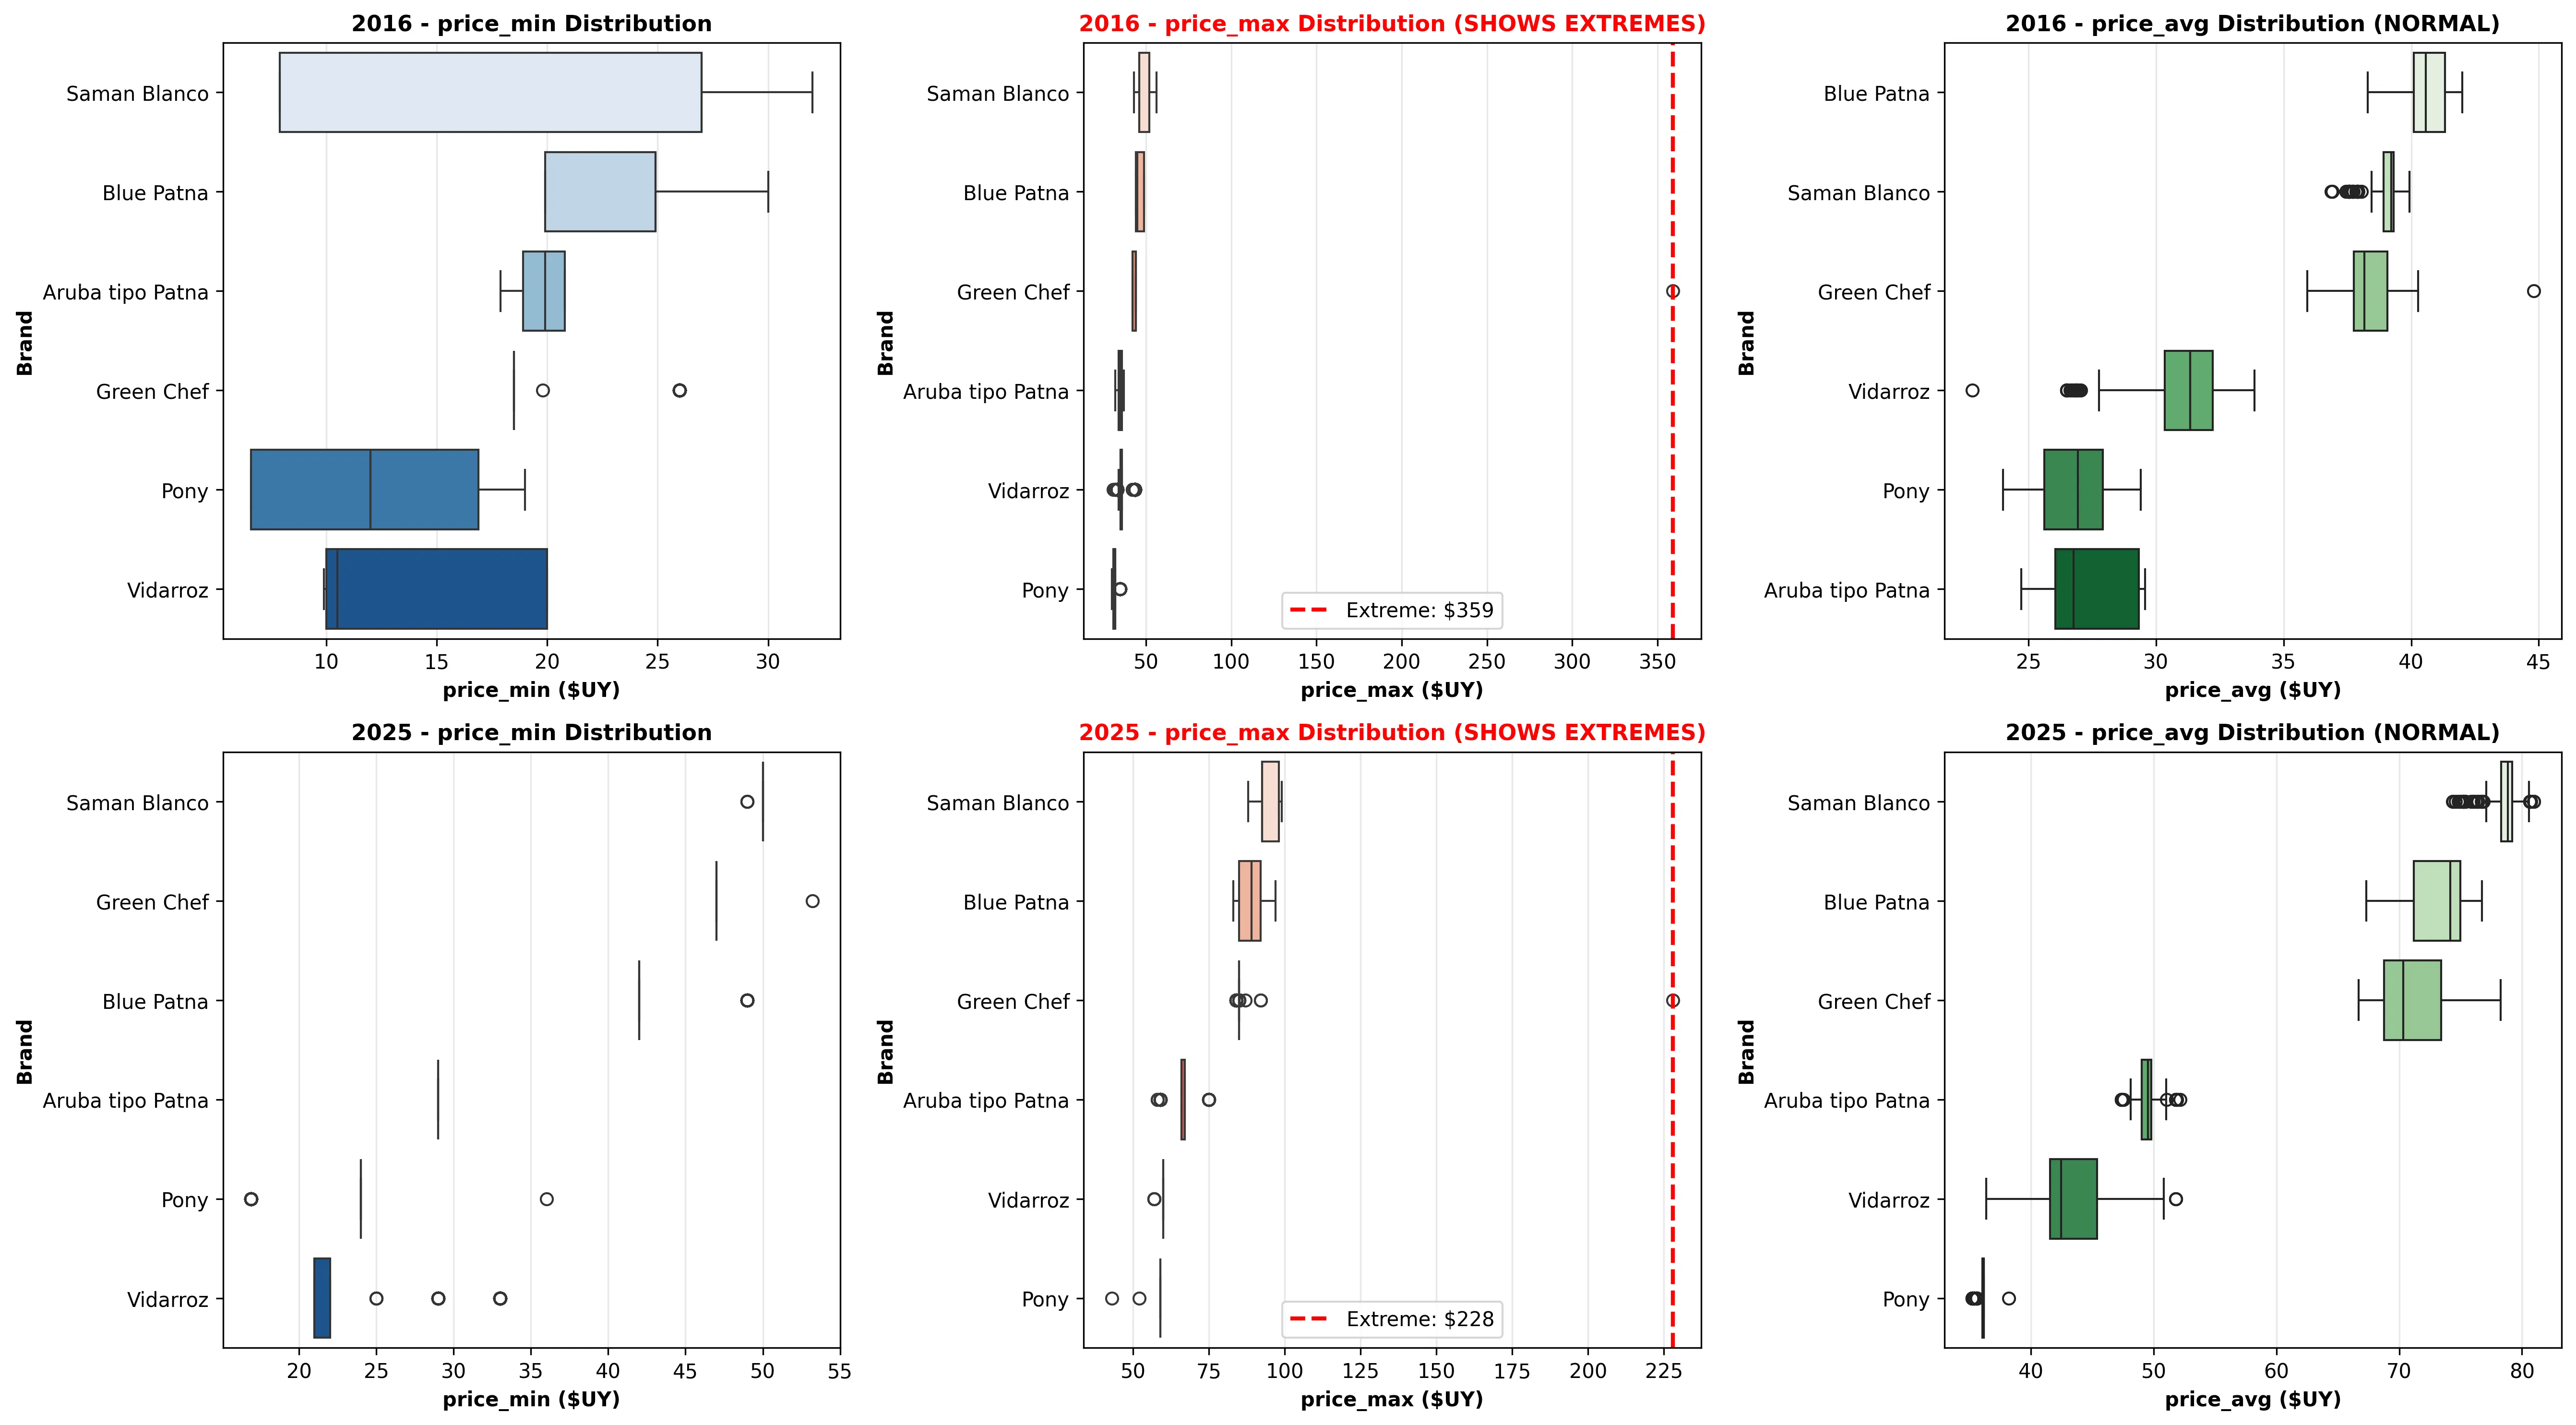
With V4, the dataset ended at 774,716 records (I removed 43,126, or 5.27%).
An additional cut: products without history
In parallel, I found another less exciting but important issue: some catalog products never had records in price history.
To keep the database consistent (and avoid shipping noise to production), I removed those products from the final catalog:
- original catalog: 379 products
- active catalog: 306 products
- removed: 73 products without history
Persistence and consistency
Before choosing a database, I considered a tempting option: this is historical, almost immutable data, so maybe files are enough. A JSON file (or CSVs) in an S3-like storage plus a service to read and aggregate could have worked.
But this project was mainly an excuse to learn. And to learn backend seriously, I wanted:
- a relational schema with constraints,
- migrations,
- indexes,
- join queries,
- and the kind of issues that appear when your source of truth is no longer a file.
So I chose PostgreSQL.
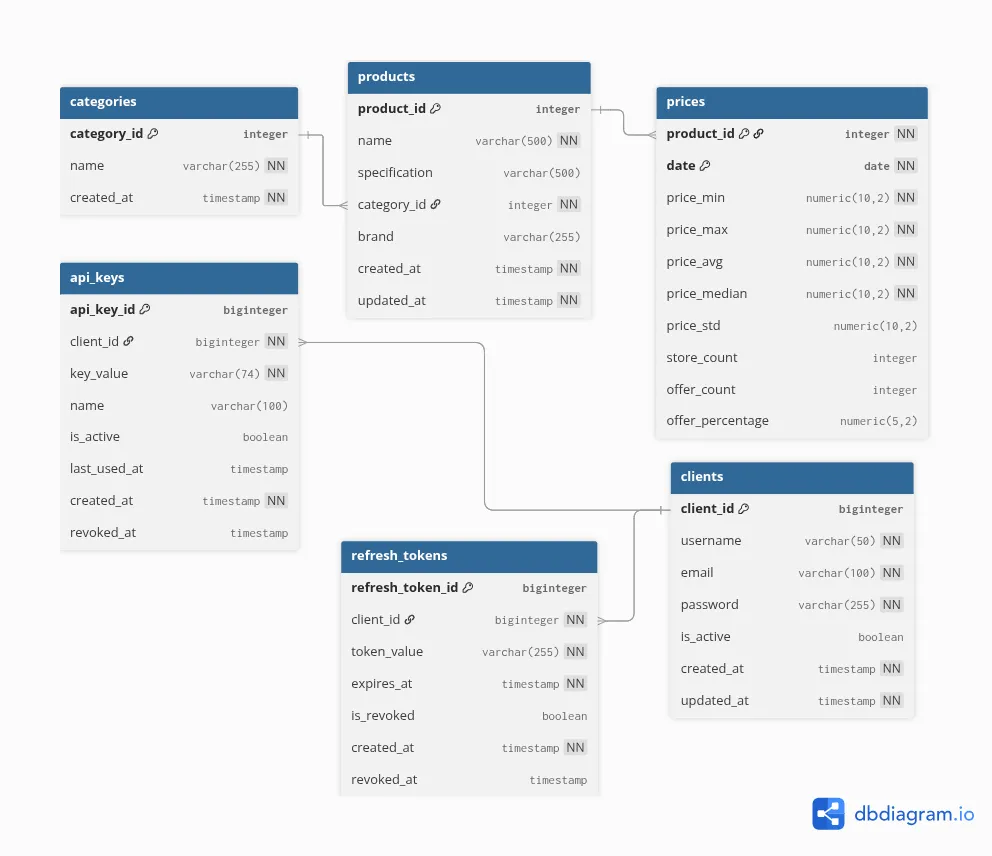
Category normalization
One thing that changed from my initial idea was how to model categories.
Instead of storing category names as plain text and trusting everything to be perfectly written forever, I normalized them. It is more work at the beginning, but in exchange you get consistency and avoid silent errors.
This makes imports a bit more complex, but it buys referential integrity and a healthier model.
The general database diagram is here:
Validation: when CSV lies
One thing I liked about moving through Postgres is that it forces uncomfortable questions:
- Are there duplicates per (product, day)?
- Do minimum, typical value, and maximum always make sense relative to each other?
- Are there nulls in required fields?
During that process I found weird cases (for example, days where a summarized value was outside the range it should belong to). Instead of ignoring it, I corrected it before loading so the database stayed coherent and queries would not return impossible results.
The web service as a product
With clean data in Postgres, the next step was the backend: moving from a dataset that only I inspect to a data source anyone can query.
The backend uses a classic stack (API + database + cache), with a clear goal: querying and analyzing should not mean opening a CSV, but a simple and repeatable interaction.
The most important part is not the endpoint list. It is the perspective shift. When you move from personal analysis to service design, questions appear that did not matter before: how to limit queries so they remain reasonable, how to make responses useful for people unfamiliar with your project, and how to avoid one bad request turning the experience into an endless wait.
Access and usage control
Even if this dataset is public, exposing a service without control is an invitation to abuse (or accidental misuse).
For programmatic use (scripts, notebooks, integrations), the most convenient mechanism is:
- API keys
Because it reduces friction: copy a key, use it, done.
And for dashboard/account management, there is a JWT path, thinking ahead to a web interface.
The idea was simple: two authentication methods for two different usage patterns.
Closing: what I learned from this project
Some takeaways beyond code:
- A large dataset does not only teach performance; it forces humility about data quality.
- Outliers are not a minor detail: they can completely change what you see in charts or metrics.
- Inflation (and time) force windowed thinking: normal depends on context.
- Modeling in Postgres with constraints helps uncover issues a CSV would forgive.
- Backend stops being just an API when you need to think about limits, cache, consumption UX, and readable errors.
If you are interested in the more technical side (without turning this into a paper), I left documentation in the repository: dataset versions, cleaning methodology, database schema, and backend phases.
Public GitHub repository: https://github.com/GabrielDLeon/canasta-uy